Network Optix
VIDEO MANAGEMENT SYSTEMNx Witness
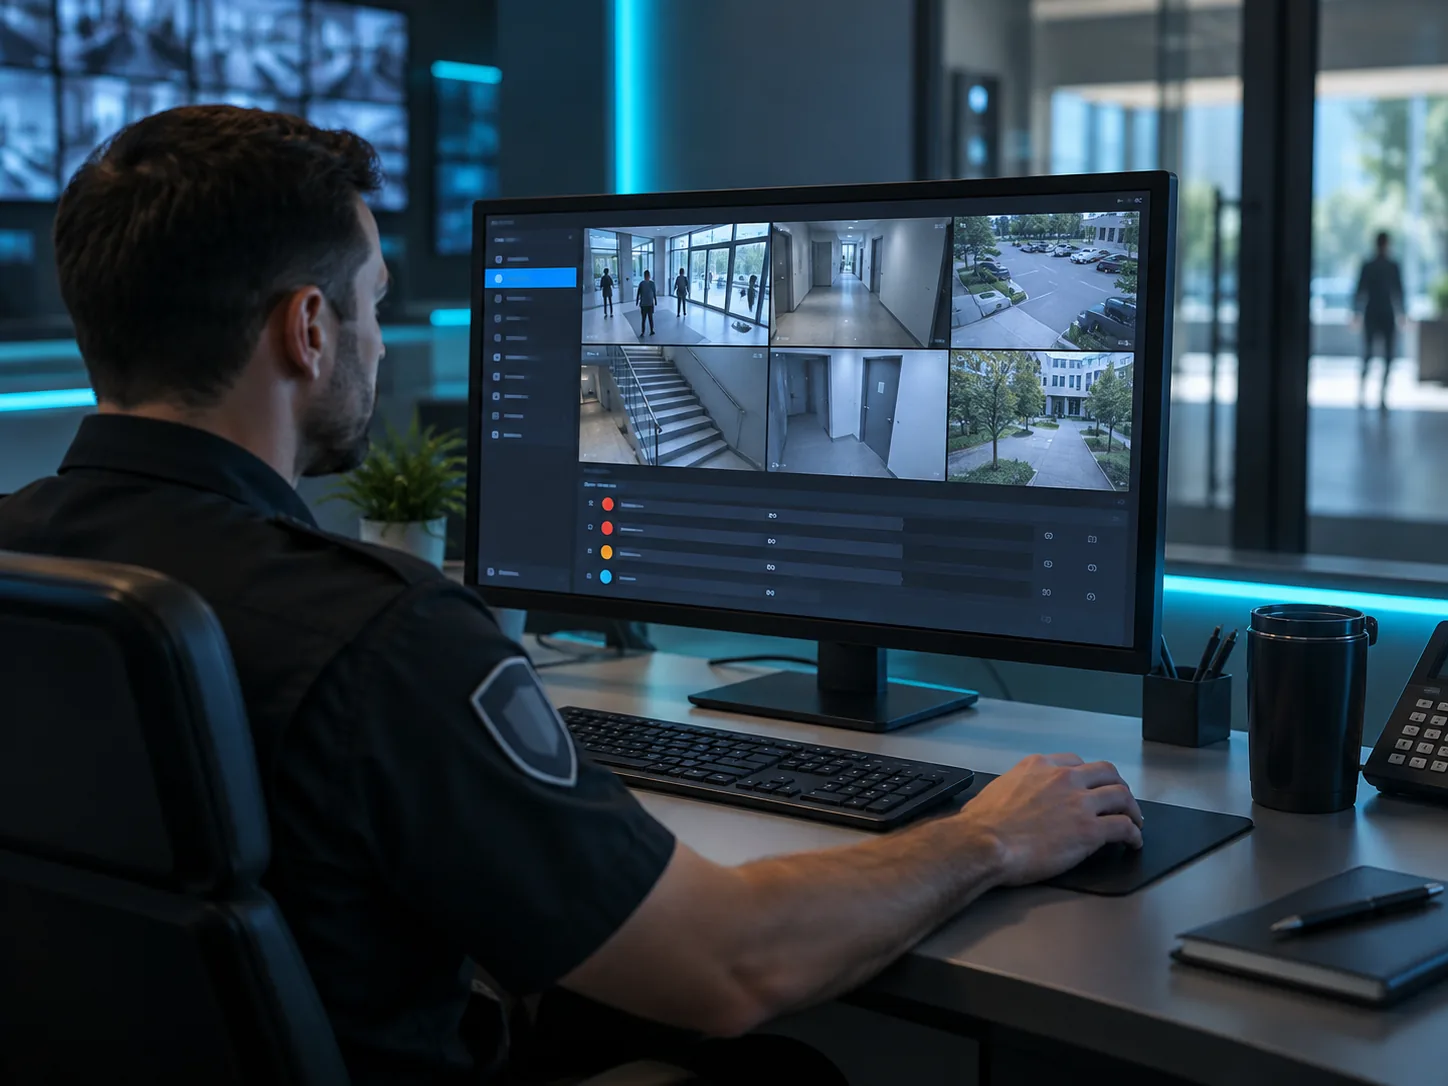
Analytics and event workflows designed around your Nx Witness environment.
Discuss the Nx Witness plugin ↗View Nx Witness (opens in a new tab)Turn everyday video into a clearer view of your world. Understand movement, protect important spaces, and make better operational decisions.

Count directional flow at the entrance and understand when the station is busiest.
People & movement
Vehicles & access
Spaces & activity
Audience & time
Click an analytics capability to see the environment, the visual output, and the operational question it helps answer.
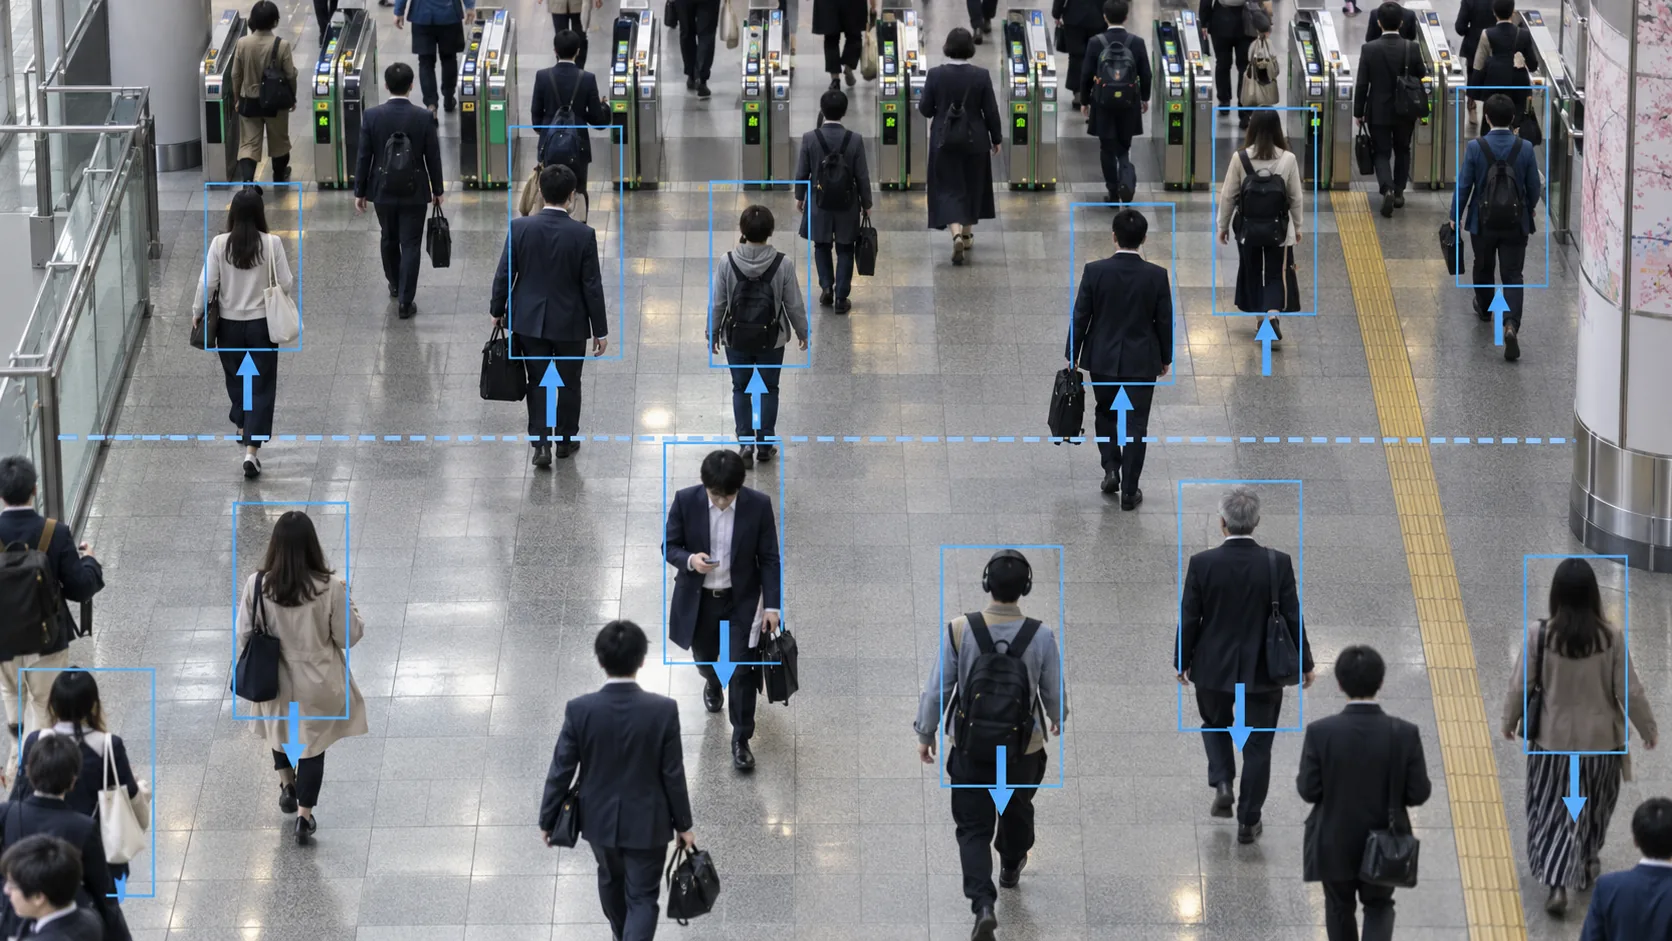
Count movement across a virtual line and compare directional flow throughout the day.
Age and gender-related outputs are estimates from appearance, not verified identity or self-identified gender. Demographic views summarize estimates; uncertain results should remain unclassified. Every scene on this page is an illustrative generated visual, not customer footage or measured output.
Bring safety, visitor experience, and site performance into one visual conversation. See the feed, understand the pattern, and decide what happens next.
Explore VMS integration ↗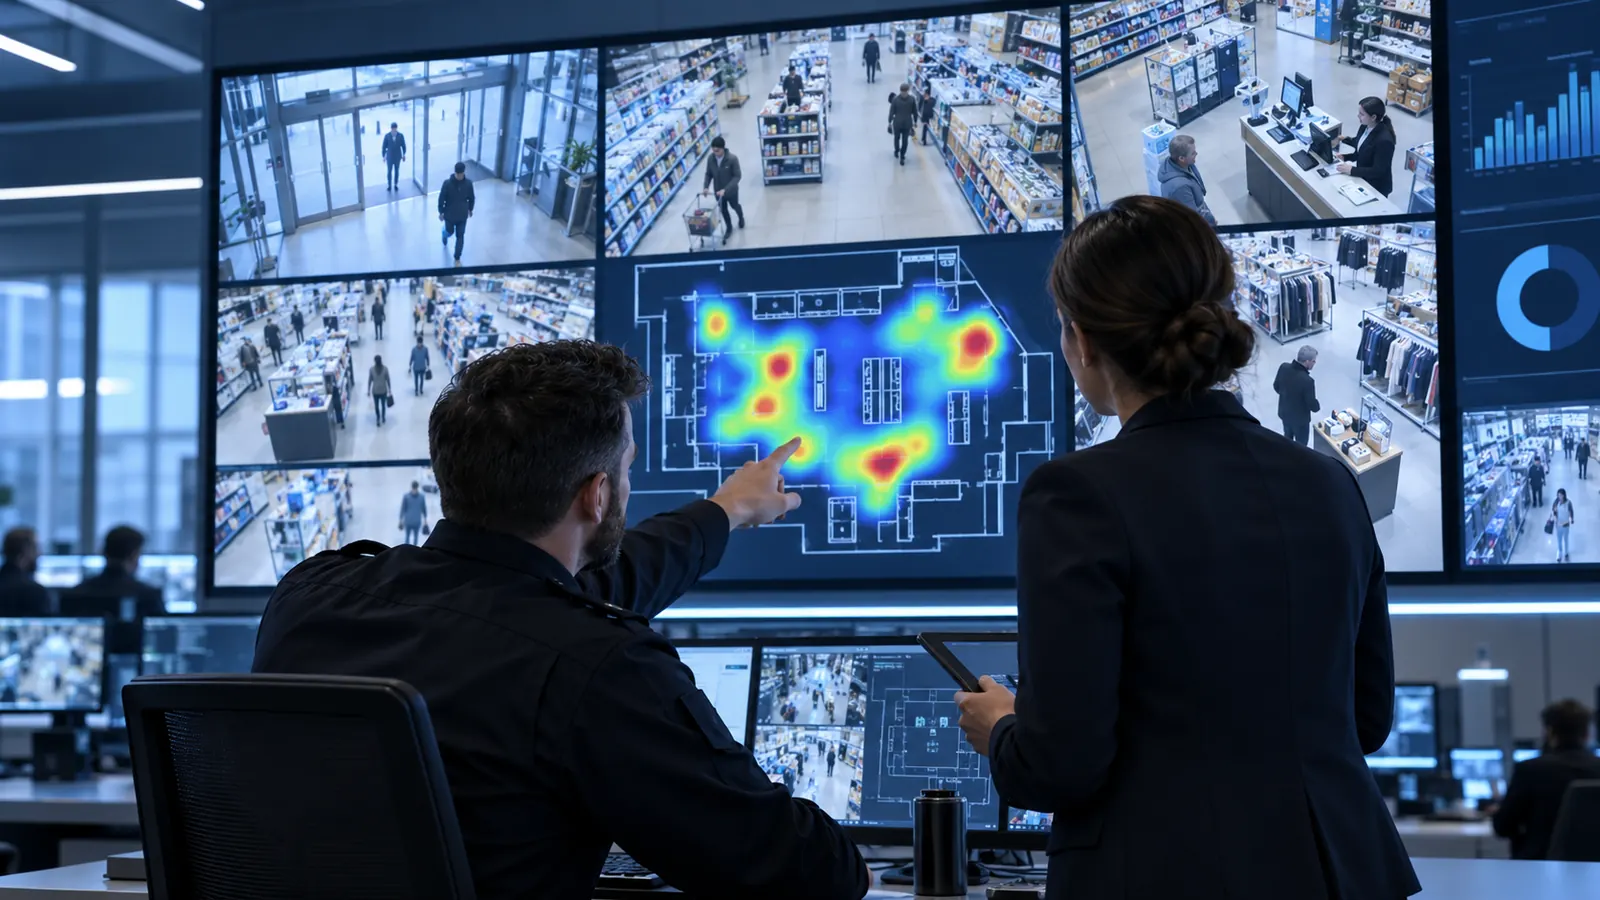
Keep the VMS your team knows. Add analytics that make every camera view more useful.
Analytics and event workflows designed around your Nx Witness environment.
Discuss the Nx Witness plugin ↗View Nx Witness (opens in a new tab)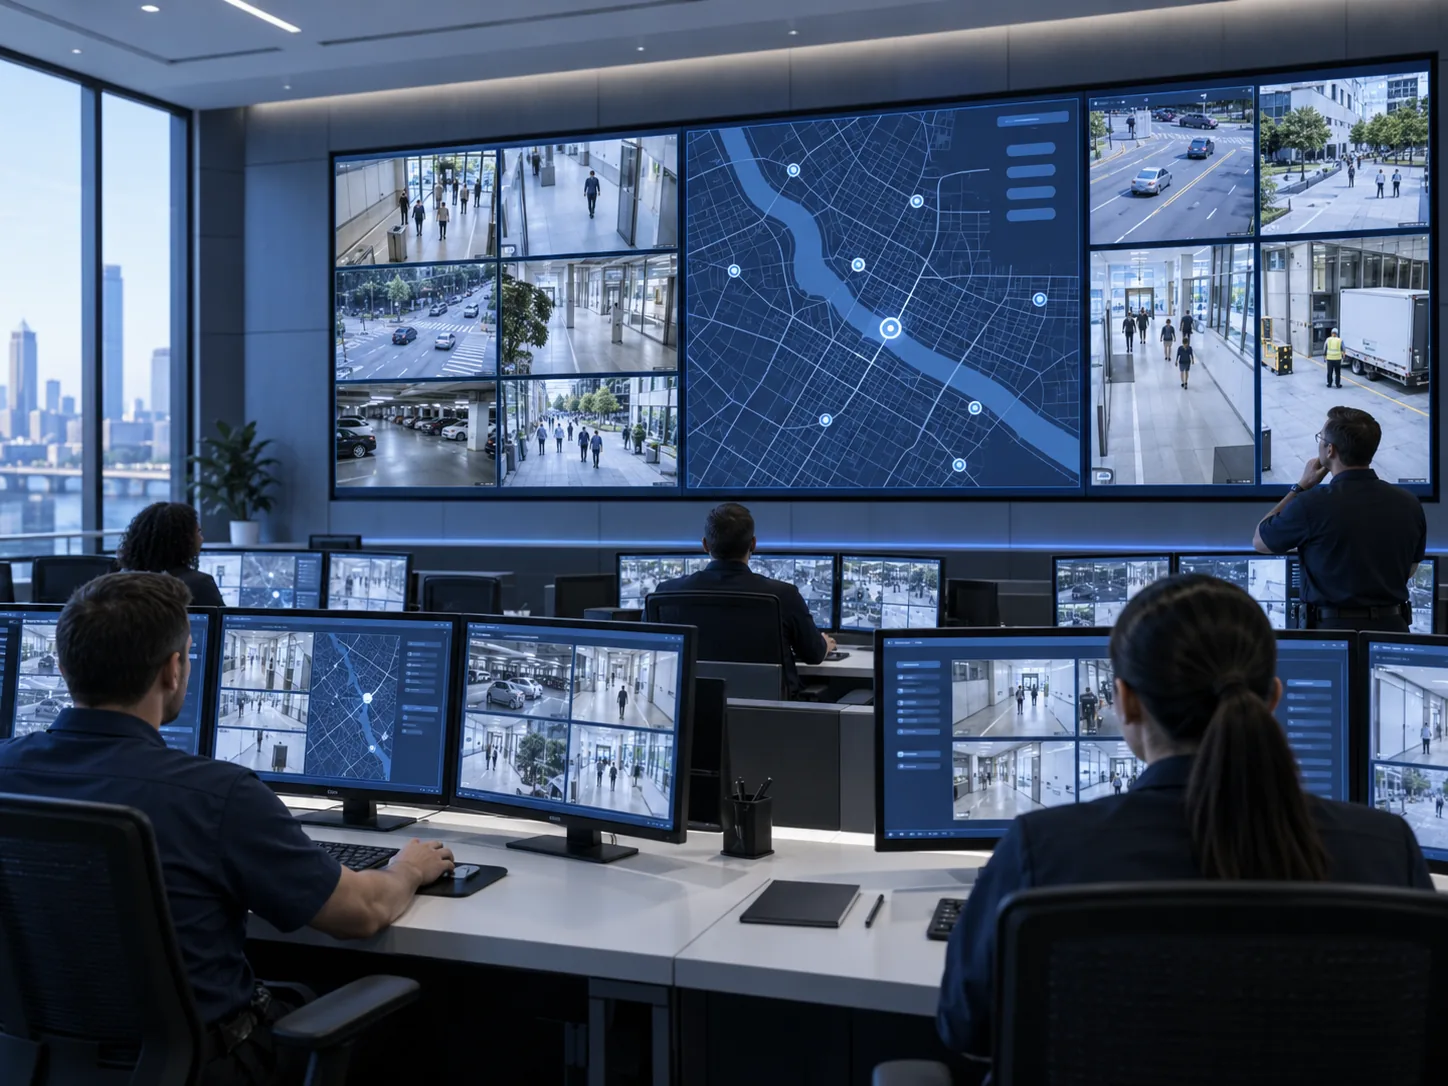
Explore analytics integration for your XProtect installation and operator workflow.
Discuss the XProtect plugin ↗View Milestone Systems (opens in a new tab)
Discuss how Ayonix analytics can fit your Genetec video management environment.
Discuss the Genetec plugin ↗View Genetec video management (opens in a new tab)Confirm plugin availability, supported VMS versions, licensing, and event capabilities with Ayonix before specifying a deployment.
Understand visitor flow, popular areas, dwell time, and aggregate audience composition.
Monitor entrances and restricted areas while learning how shared spaces are used.
Review vehicle activity, protected boundaries, and movement around operational zones.

What do you need to see, understand, or respond to? Build the deployment around that outcome.
Share your camera models, streams, VMS edition, and version with Ayonix. Compatibility and supported plugin features should be confirmed for your deployment.
Heatmaps show relative activity across a space. Dwell time describes how long people remain inside a selected area.
They summarize estimated age ranges and visual gender-presentation categories in aggregate. They are not verified identity or self-identified gender.
Turn IP camera streams into visual context for the people responsible for your operation.
Request a demo