
Is the store attracting the audience the collection was designed for?
Compare visitor mix before and after product drops, campaigns and window changes — then read the pattern alongside footfall, dwell and sales data.

Customer demographics
Turn everyday retail video into aggregate age-band and gender-presentation insight — so merchandising, staffing and campaign teams can plan with evidence instead of instinct.
From traffic to decisions
Footfall tells you how many people arrived. Demographic analytics helps explain which audience segments came, when they came, and where engagement changed.

Compare audience mix by store, zone, time of day and campaign period.
Align service coverage with the customers who actually arrive.
See whether a window, a promotion or a media placement changed traffic quality.
One operational view
Move from isolated detections to a shared view of customer mix across stores, entrances, zones and time periods.
Configurable ranges, so a change in audience shows up without presenting a false level of precision.
Aggregate probabilistic estimates, held to a confidence threshold, with an uncertain category that stays visible.
Compare patterns by hour, day, store, entrance or campaign window.
Send aggregated events to dashboards, warehouses and reporting tools through APIs or exports.
Built around retail questions
Compare visitor mix before and after product drops, campaigns and window changes — then read the pattern alongside footfall, dwell and sales data.
Understand aggregate visitor mix across beauty zones and hours, and use it to refine promotions, service coverage and merchandising.
Compare anonymised demographic patterns across zones and tenants to support leasing narratives, event planning and media sales.
Measure aggregate audience composition and attention windows, with policy-controlled outputs and no identity required.
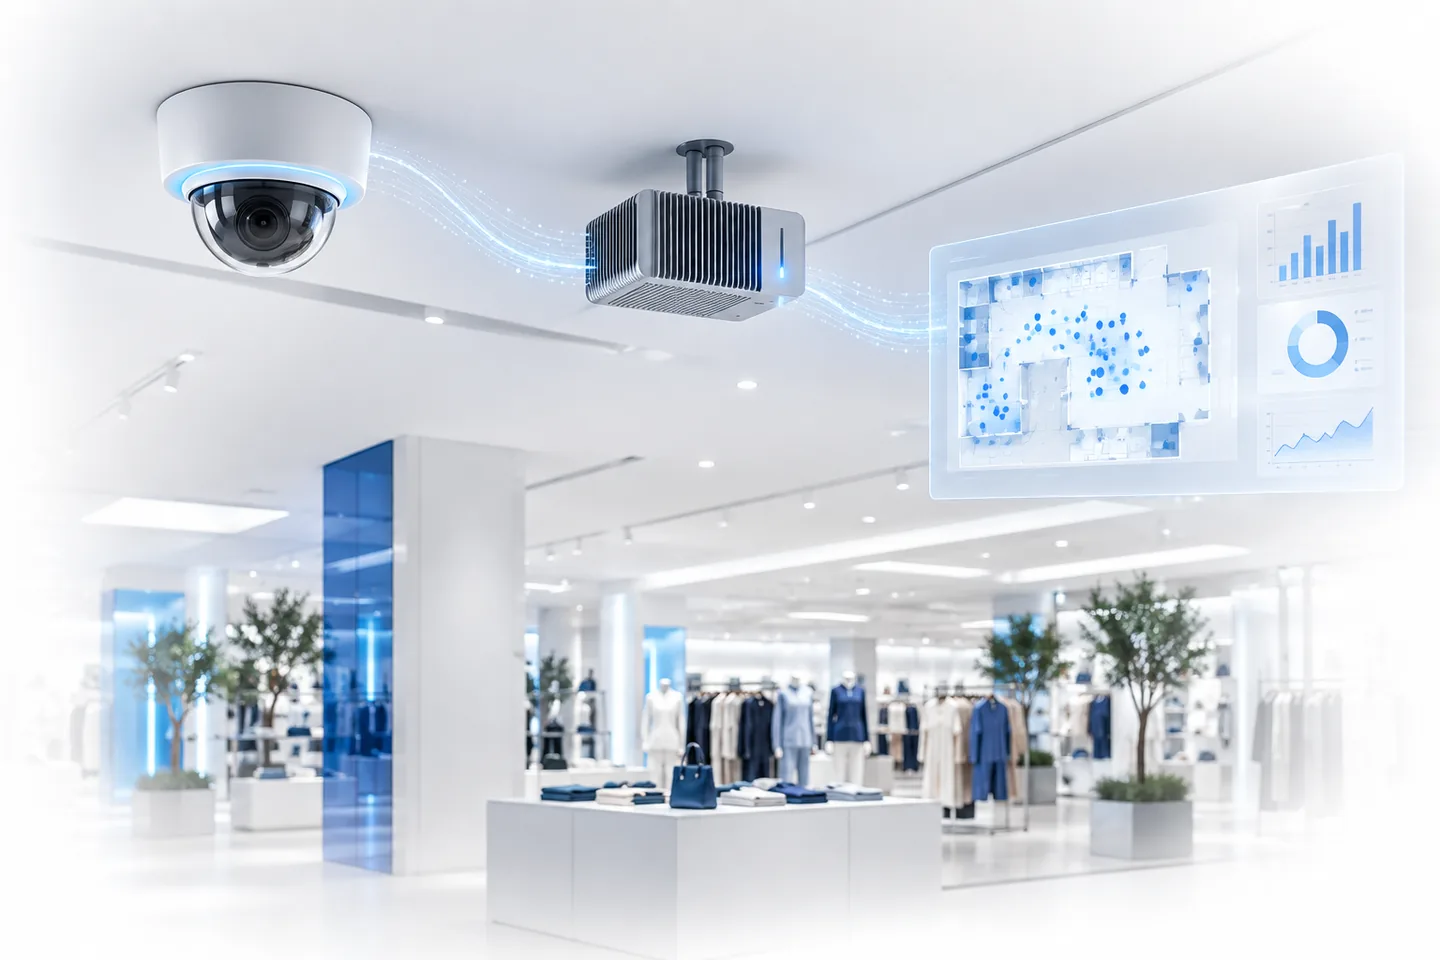
Camera to business intelligence
Use compatible cameras and choose where processing and data live. Ayonix engineers review real footage, tune thresholds, and connect aggregated results to the systems your teams already open every morning.
Review your camera environmentResponsible by design
A demographic output is an estimate, not a fact about a person. The deployment has to be designed around a documented purpose, the law that applies where it runs, and your own policy.
Report group-level patterns. Neither enrolment nor identity matching is required for this analysis.
Configure image, event and metadata retention separately, around the minimum the operation actually needs.
Use confidence thresholds, keep an uncertain category in the report, and validate on footage from the site itself.
Do not use a demographic estimate on its own to decide eligibility, pricing, employment or anything else with a high impact on a person.
A practical evaluation path
No brochure can predict field performance. Start with representative video, a defined question and a controlled proof of concept.
Choose the business question, the zones, the audience labels and what a useful answer looks like.
Check camera position, lighting, face size, motion, crowding and coverage against the question.
Measure detection coverage, estimation quality, latency and whether the reporting answers the question.
Connect the systems, document the policy, train the teams and keep monitoring performance site by site.
Not for this analysis. Customer Demographics runs as aggregate analytics, and neither enrolling shoppers nor matching them against a database is required to report age-band and gender-presentation mix.
Often, yes. Whether a given camera is usable depends on its angle, the size of a face in frame, lighting, motion and compression. Ayonix reviews representative footage from your own site before a deployment is proposed.
As probabilistic estimates for aggregate analysis. Age is reported as a band rather than a number, gender as a gender-presentation estimate rather than a fact, and results below the confidence threshold stay in an uncertain category instead of being forced into a group.
Yes. Aggregated events can be delivered through APIs or scheduled exports into approved dashboards, warehouses and reporting workflows. Which systems, which fields and how often is settled during solution design.
At the edge, on-premises, or in a cloud environment you have approved. The right choice depends on latency, camera count, network conditions, security review and where your data-governance policy allows the video to go.
No. A demographic estimate is not evidence about an individual, and Ayonix does not support using it on its own for eligibility, pricing, employment or any other decision with a high impact on a person. Use it for aggregate planning, and keep individual decisions with people and with data that was collected for that purpose.
Start with a real store
Share your camera layout, some sample footage and the question you need answered. We will help scope a measurable, privacy-conscious proof of concept.